

Raketech's Q2 2026: Revenue -17.6% Under an 'EBITDA Improvement' Headline, Fact-Checked


Contents 14
"Continued EBITDA Improvement, highlighted by the Largest Sports Campaign to Date." That's the title Raketech, a Malta-based iGaming affiliate company listed in Stockholm, gave its second-quarter 2026 report on August 19. The first line of the table under it: revenue down 17.6%.
This is our review of the report for affiliates, publishers and anyone who sells traffic to iGaming operators: what the numbers show, how the text frames them, what the decline is made of, and how it compares with listed peers. A company report isn't a traffic case, so we read it as an anti-case: the score rates how honestly and in detail the decline is explained. Editorial fact-check: 3/5.
Short version: every number is in the report, including the uncomfortable ones, and the tables reconcile. But the headline uses the kindest comparisons: the "improvement" is quarter on quarter, the decline excludes a business sold last year, the revenue fall is put down to "product mix" without numbers, and the World Cup campaign comes with no figures at all.
Who Raketech is
Raketech owns affiliate sites, mostly Nordic casino and sports brands and TV sport guides, and runs AffiliationCloud, a sub-affiliate platform that sells other publishers' traffic to operators. Its shares trade on Nasdaq First North in Stockholm. The report is signed by CEO Johan Svensson, a co-founder, and is unaudited.
Its recent history is a shrinking one: revenue of about €51M in 2024 and €27.0M from continued operations in 2025. In September 2025 it sold its Casumba assets "following regulatory developments impacting its market," and in June 2025 its US betting tips assets.
The headline table
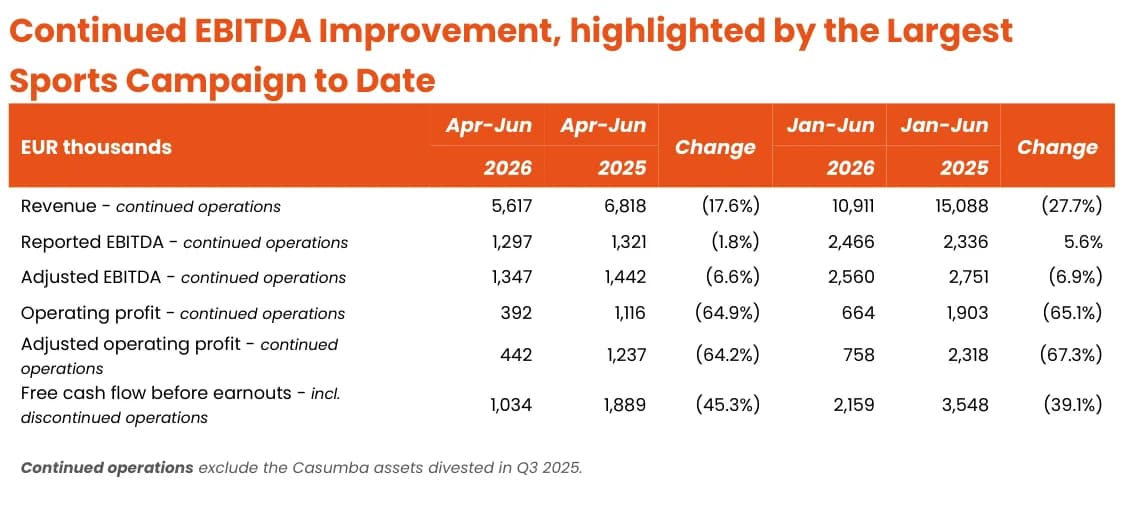
Our math: every line in the table is down year on year. The "improvement" in the title is against the first quarter of 2026: adjusted EBITDA €1.35M against €1.21M. Year on year, adjusted EBITDA fell 6.6% and reported EBITDA 1.8%. Operating profit fell 64.9% and the quarter's net result went from a €419K profit to a €155K loss.
The adjusted EBITDA margin did rise, to 24.0% from 21.2%. The CEO credits "an improved revenue mix and a lower cost base." The lower cost base is real: employee costs fell 40%, from €1.73M to €1.04M, with full-time staff down from 87 to 54.
Our take: a rising margin on falling revenue is what cutting a third of the staff looks like. It's a defensible decision and an honest number. Calling it "improvement" in a title, when the year-on-year line is negative on every metric, is the framing an affiliate should notice.
The 2 decline numbers
The report's own key data table carries both:
- revenue from continued operations: €5.62M against €6.82M, -17.6%;
- revenue including discontinued operations: €5.62M against €7.83M, -28.2%; for the half year, -37.9%.
The headline and the CEO's comment use the first. The difference is Casumba, sold in the third quarter of 2025.
Our take: excluding a sold business is standard accounting, and the report discloses the full number 3 pages later. But the business didn't just disappear: Raketech sold it for €12.0M payable monthly through December 2029, booked at €6.8M, while the only earnout the report's note on acquisitions discusses, Casumba's, still stands at €21.3M owed. More on that below.
Where the €1.2M went
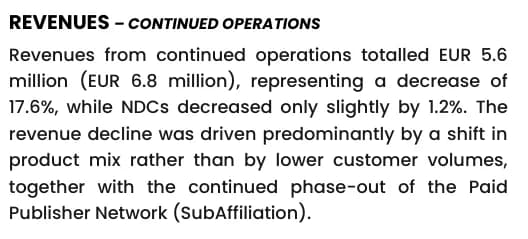
The text gives 2 explanations. Page 2: "the continued phase-out of the Paid Publisher Network within SubAffiliation, together with softer revenues in non-core markets within Affiliation Marketing." Page 8: "The revenue decline was driven predominantly by a shift in product mix rather than by lower customer volumes," with new depositing customers down only 1.2%.
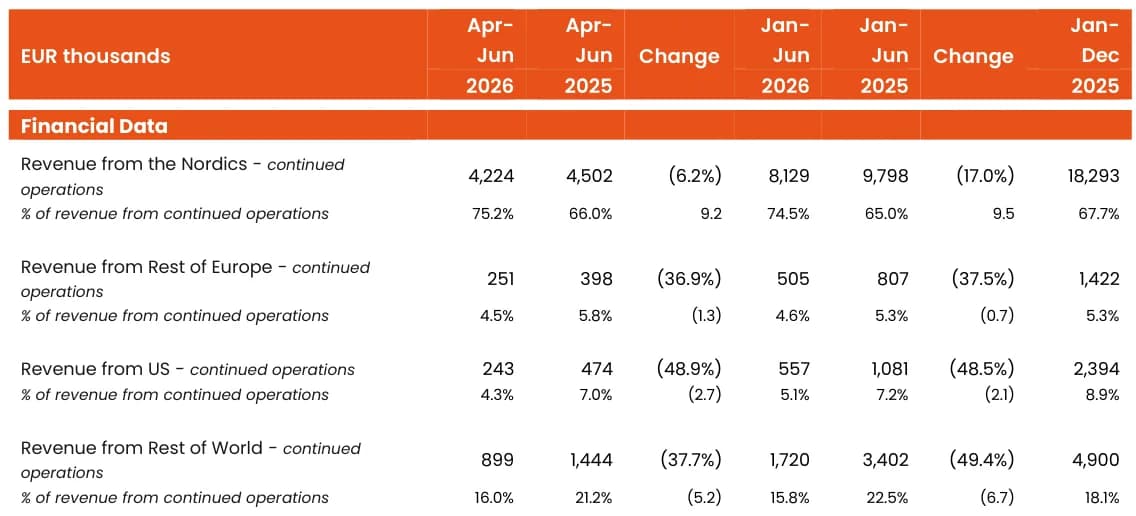
The region table shows where:
Our math:
- the €1.2M drop splits into Nordics -€278K, Rest of Europe -€147K, US -€231K and Rest of World -€545K, so 77% of it came from outside the Nordics;
- by segment, owned sites fell 14.7% and sub-affiliation 19.3%;
- by model, multiplying each share by revenue: revenue share fell about 25%, from about €3.35M to €2.49M; upfront payments fell about 26%; flat fees rose about 13%, from €1.66M to €1.87M;
- revenue per new depositing customer, the NDC count the report uses, fell from €430 to €358, -16.6%.
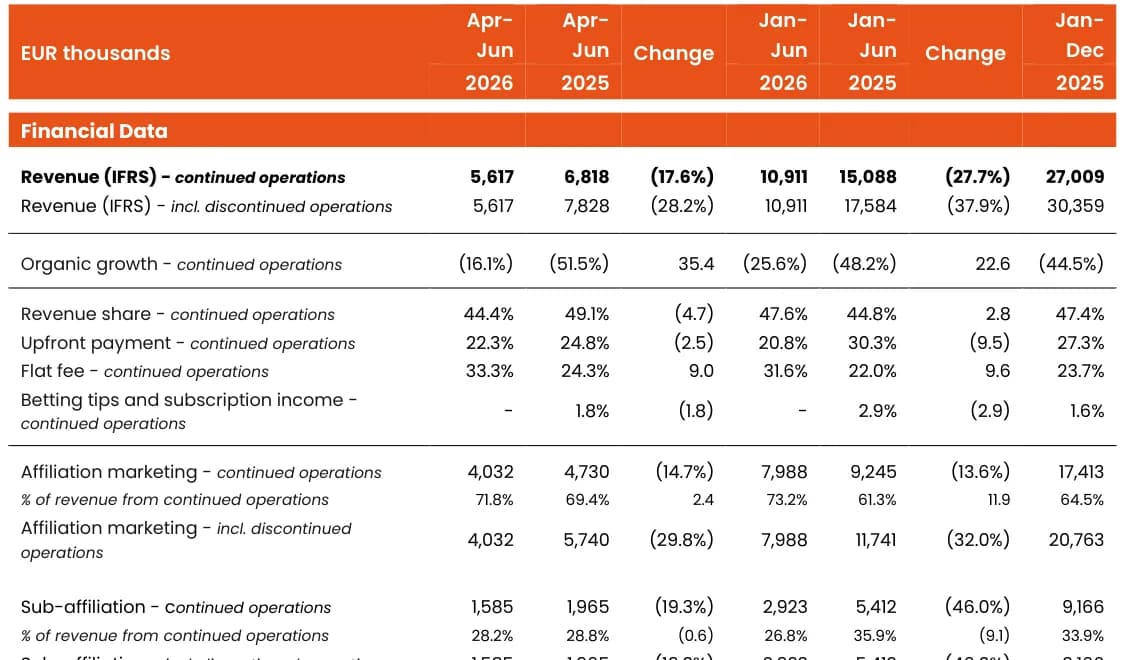
Our take: "product mix" is the right answer, and the report never puts numbers on it. The numbers above are ours, from its own tables: the company now earns less per depositor, because more of its revenue comes from flat fees and less from revenue share, the model that pays over a player's lifetime. Raketech's CEO said on the first-quarter call that Denmark was considering a ban on revenue share and that the company was shifting toward CPA and upfront payments. The second-quarter report doesn't mention it. For any affiliate in the Nordics, that's the most important sentence not in the report.
"Softer revenues in non-core markets" is how the report describes a US business that halved and a Rest of World business that lost 38%. On the first-quarter call the CEO named the US cause: 1 of the larger US publishers "didn't develop as expected." The second-quarter report says only that the US "has yet to return to growth."
The World Cup: "the largest sports campaign" without a number
The CEO: activity "accelerated towards the end of the period as investments around the FIFA World Cup increased. This resulted in the largest sports campaign in Raketech's history." 2 new media products launched before the tournament, which the CEO calls "an operational success."
Our math: the report gives no campaign revenue, spend or depositors. The proxy is sport revenue: €2.14M, up 19.9% from the first quarter and down 2.8% from a year earlier. Casino revenue was flat quarter on quarter. July, by the report's preliminary data, was "slightly stronger than the Q2 average" for owned sites.
Our take: "largest ever" without a number or a previous record to compare is a press release phrase, not a result. Peers make the contrast sharper: Better Collective reported 9% revenue growth to €89M and 24% more new depositing customers, crediting the World Cup. Raketech's depositors fell 1.2% in the same quarter.
The accounting line that moved operating profit
Depreciation and amortisation rose from €0.2M to €0.9M, "as a result of a change in accounting estimate." Note 2.7 explains: certain websites and domains moved from an indefinite useful life to 8 years, from October 1, 2025, citing "updated information and developments with regards to market conditions and product performance."
Our math: operating profit fell by €724K; the amortisation change added about €700K. Almost the whole operating profit drop is this line.
Our take: that's not a trick, it's the opposite: the company is admitting some of its sites are worth less over time than it had assumed. The report's note on impairment adds the warning: "If the EBITDA CAGR over the next five years had to fall below 7.7%, impairment would most likely arise." For a company whose EBITDA fell year on year this quarter, that's a sentence worth rereading.
Debt and earnouts
The balance sheet, from the report:
- cash: €5.18M;
- bank borrowings: €3.1M drawn on a €5.0M facility, secured by a pledge of the main operating subsidiary's shares;
- amounts committed on acquisition: €21.3M fixed, with €7.7M due within 12 months, its payment period extended to March 2028 with about €3.9M of expected interest;
- net interest-bearing debt: €19.3M, 3.55 times last-12-months adjusted EBITDA, up from 2.17 times a year earlier.
Our math: €3.12M of borrowings plus €21.32M of earnout minus €5.18M of cash is €19.27M, which matches the report. €7.7M due within a year against €5.2M of cash and €2.2M of free cash flow before earnouts in the first half: the payments depend on future cash generation, which the report says is how they'll be settled, as "a percentage of the Group's available free operational cash flows."
Our take: the company owes €21.3M in earnout and is owed €12.0M nominal, €6.8M on the books, for a business it sold with no upfront cash. Nothing in the report is hidden; it's simply not where the headline is.
The market's reading
The shares closed at 1.63 Swedish kronor on August 18 and at 1.50 on August 19, the report day, -8%; by October 1 they were at 1.285. Part of the fall came in the days before publication. At 1.285 kronor the company was worth about 58M kronor on the market, against €32.1M of book equity.
How peers did in the same quarter
- Raketech — €5.6M. -17.6%, or -28.2% with Casumba
- Better Collective — €89M. +9%, depositors +24%
- Catena Media — €9.5M. -1%, blaming organic search
- Gambling.com Group — $37.8M. -5%, marketing revenue -10% on lower SEO revenue
Our take: 2 of 3 peers blame organic search for weak affiliation revenue; Raketech blames its own paid network phase-out and "mix," and doesn't discuss Google at all this quarter. Better Collective's growth shows the World Cup was a real opportunity for those positioned to monetize it.
Fact-check: what the company showed and what it hid
We rate every case on 10 points: what an outsider needs to judge the result. For a listed company's quarterly report, the points become its segments, models, regions, costs, balance sheet and how candidly the text explains them. Like most case studies, this one is selectively true.
- Setup: segments, regions, models — Showed. Revenue by segment, region, product and payment model, for the quarter, the half year and 2025.
- Author and independence — Partial. A listed company reporting on itself, unaudited, signed by its CEO.
- Finances — Showed. Full income statement, balance sheet and cash flow, with net debt that reconciles to the euro.
- Proof — Partial. Statutory tables, but no traffic, ranking or campaign data behind the claims.
- Explanation of the decline — Partial. "Product mix" and "non-core markets," with no numbers on either; the US publisher and Danish revenue share risk named on the earlier call are left out.
- Framing of the headline — Hid. The title's "improvement" is quarter on quarter; the -28.2% including the sold business is 3 pages in.
- World Cup campaign — Hid. "Largest ever" with no revenue, spend or depositors.
- Costs — Showed. Staff, publisher and other costs, and the amortisation change, explained in a note.
- Debt and earnouts — Showed. €21.3M of earnout, the extension, interest and the 12-month portion are all disclosed.
- Outlook — Partial. No numeric guidance; "gradual improvement" and a July that was "slightly stronger."
Score: 3/5. As disclosure, this report is thorough: every uncomfortable number is in it, and the tables reconcile. As explanation, it's selective: the headline picks a quarter-on-quarter comparison and a decline that excludes a sold business, the cause of the fall is reduced to "product mix," the World Cup result has no number, and the regulatory risk its CEO named 3 months earlier is missing. Transparent tables, flattering text: a 3.
Checklist: what to do
Questions and answers
How did Raketech do in Q2 2026?
Revenue from continued operations fell 17.6% to €5.6M, or 28.2% including the Casumba business it sold in 2025. Adjusted EBITDA fell 6.6% to €1.35M but rose from the first quarter, and the margin rose to 24.0% after staff cuts. Operating profit fell 64.9%.
Why did Raketech's revenue fall?
The report cites the phase-out of its paid publisher network in sub-affiliation, softer revenue in non-core markets and a shift in product mix. By its own tables, 77% of the decline came from outside the Nordics, and revenue share income fell about 25% while flat fees grew.
Is revenue share disappearing in iGaming affiliation?
Not disappearing, but shrinking in some markets. At Raketech revenue share fell from 49.1% to 44.4% of revenue in a year while flat fees rose to 33.3%, and its CEO said in May 2026 that Denmark was considering a revenue share ban.
How did other listed affiliates do in Q2 2026?
Better Collective grew revenue 9% to €89M with 24% more new depositors, helped by the World Cup. Catena Media was flat at €9.5M and Gambling.com Group fell 5% to $37.8M, both pointing to weaker organic search.
Author’s conclusion
Raketech's report is a good example of a company telling the truth in its tables and the best version of it in its titles. Everything an analyst needs is there: revenue down 17.6% or 28.2% depending on the base, operating profit down 64.9%, a shift from revenue share to flat fees, 77% of the decline outside the Nordics and €21.3M of earnouts against €5.2M of cash. What the text adds is framing: an "improvement" that's quarter on quarter, a "product mix" that's never measured, and a World Cup record without a figure, in a quarter when a bigger peer grew 9%.
My advice: when you read a listed affiliate's report, start at the year-on-year column and the payment model split, and read the previous call for risks that didn't make it into the release. For working affiliates the useful signal here is market-wide: operators are moving deals from revenue share to flat fees and upfront payments, and in the Nordics regulators are looking at revenue share itself. Price your traffic and your contracts for that.
Lu Discover, Editor-in-chief
Our verdict on this case
As disclosure, this report is thorough: every uncomfortable number is in it, and the tables reconcile. As explanation, it's selective: the headline picks a quarter-on-quarter comparison and a decline that excludes a sold business, the cause of the fall is reduced to "product mix," the World Cup result has no number, and the regulatory risk its CEO named 3 months earlier is missing. Transparent tables, flattering text: a 3.
Our fact-check of the public case: what the numbers show, what is missing. Scores are never for sale.
Sources for this article
- mfn.se — Raketech: Q2 2026: Continued EBITDA improvement, highlighted by the largest sports campaign to date, press release (August 19, 2026)
- storage.mfn.se — Raketech: Q2 2026 interim report, PDF
- storage.mfn.se — Raketech: Annual report 2025
- inderes.se — Better Collective: Q2 2026 report
- quartr.com — Catena Media: Q2 2026 results
- allinvestview.com — Gambling.com Group: Q2 2026 results
- finance.yahoo.com — Raketech share price history, RAKE.ST
Related stories
 Case fact-check
59% of Installs Were Bots: An Indie Developer's Google App Campaign, Fact-Checked
 Case fact-check
An AI Astrology Bot on Facebook Ads: $300, 77 Unpaid Invoices and 0 Sales, Fact-Checked
 Case fact-check
Comments
0 commentsNo comments yet.
Add a comment