

Revenue Up 19%, Ad Spend Up 52%, Profit Flat: Fact-Checking a $375K Amazon PPC Income Report

Contents 12
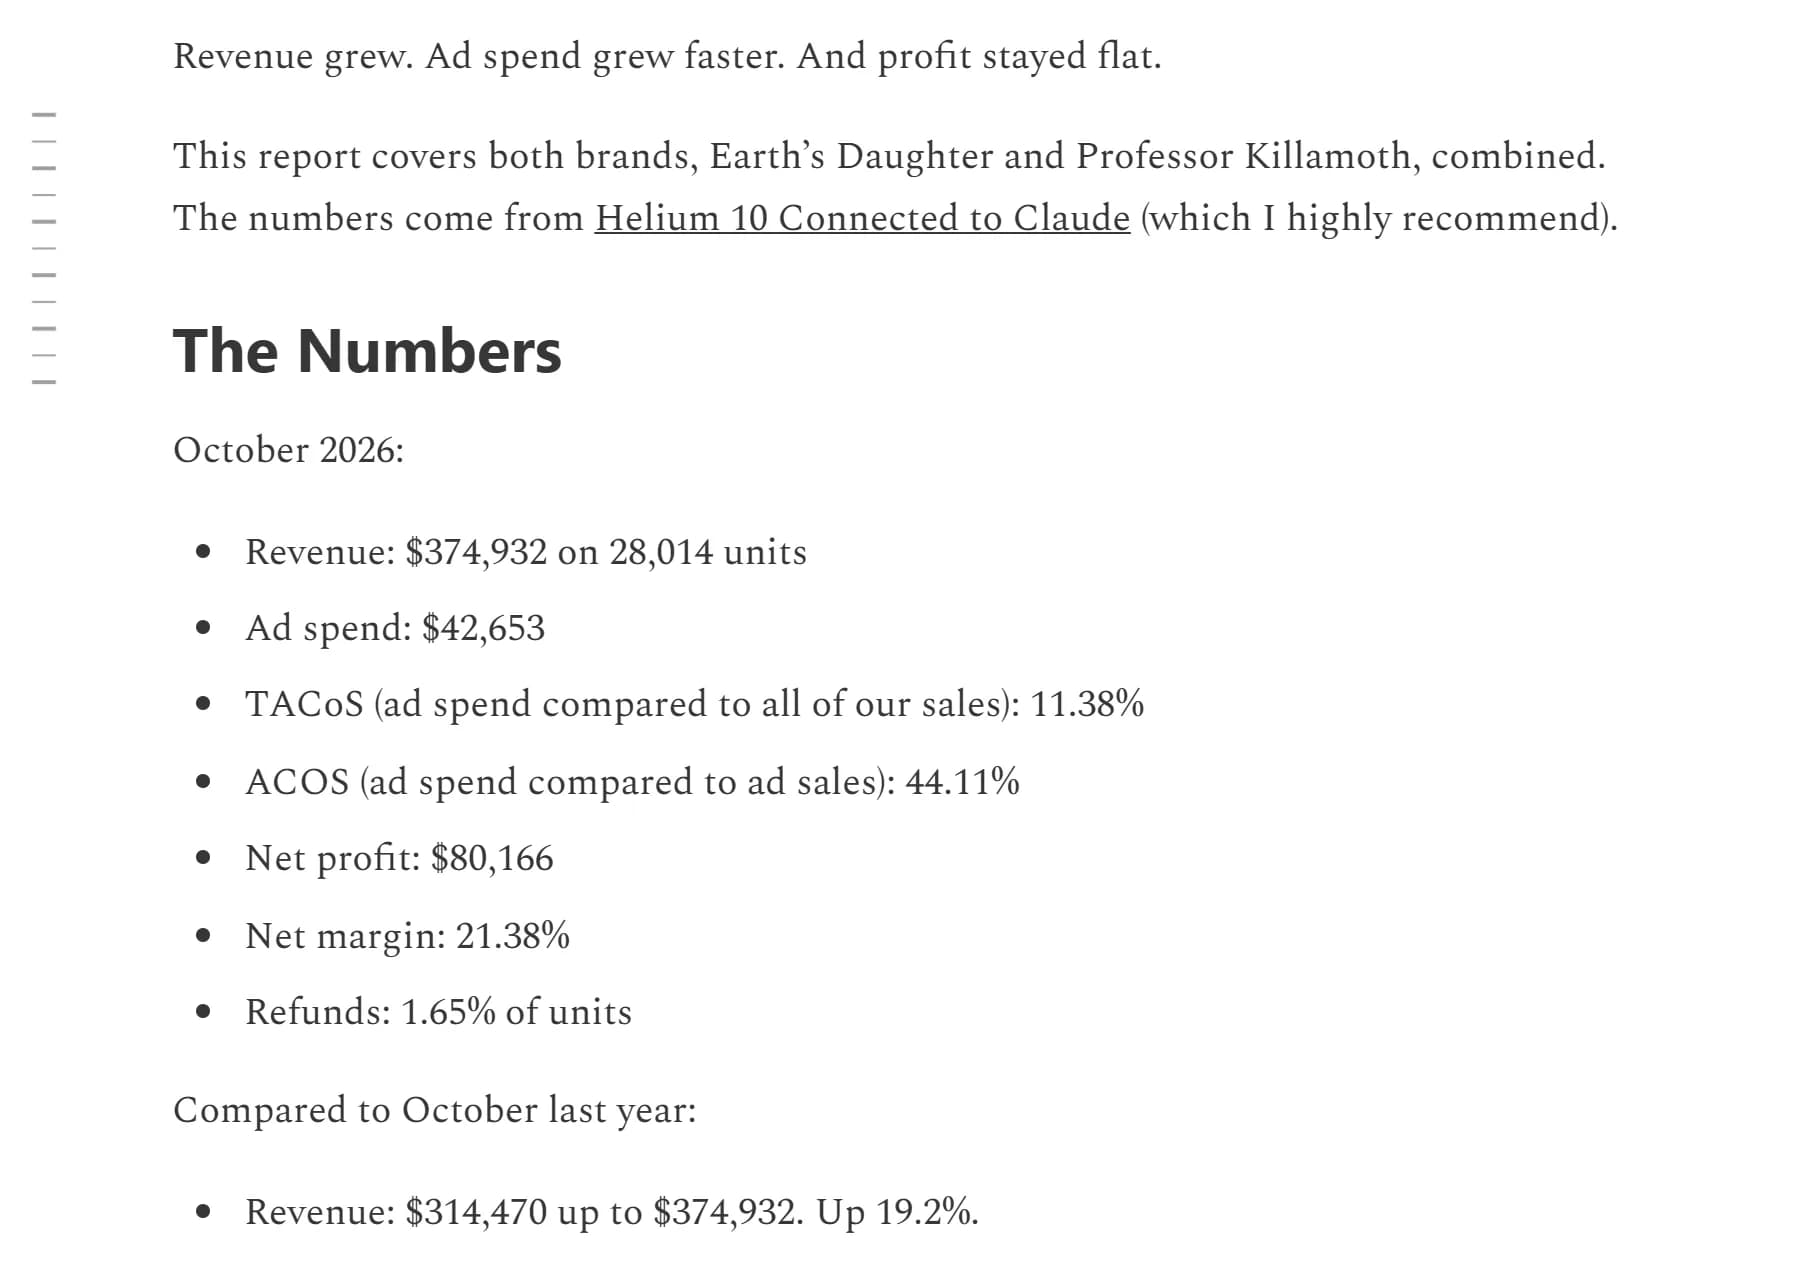
An Amazon seller with 2 small brands, organic lip balm and moth traps, publishes his October numbers: $374,932 in sales, $42,653 in Amazon ads, $80,166 in net profit. Revenue is up 19% on last October, ad spend is up 52%, and profit is exactly where it was in September. "Revenue grew. Ad spend grew faster. And profit stayed flat," he writes, and explains why.
That's a rare kind of report: a seller saying his ads bought growth that didn't pay. This is our review for media buyers who report ROAS, buy traffic for their own products or pitch brands that sell on Amazon: the October report, the 4 reports before it, his own dashboards, our math and what changed between them. Editorial fact-check: 2/5.
Short version: the October numbers are consistent with each other to the cent, and the lessons on ACOS, TACoS and inventory are sound. But the profit line doesn't hold still. His own dashboard put September's profit at $92,762; this report uses $80,047. August went from $109,914 to $56,561 a month later. October has no dashboard at all, and the newsletter is a channel for an investment fund, a PPC agency and an affiliate link to the tool behind the numbers.
Who is reporting, and what the newsletter sells
The author is Dr. Travis Zigler. His own bio: "Recovering optometrist. Sold Eye Love in 2021. Now I buy and scale health and wellness brands at Freedom Brands and run Profitable Pineapple Ads."
He bought the 2 brands this summer. "At noon today I wired the money, signed the documents, and became the owner of two brands," he wrote on June 25, 2026, calling it "the first larger acquisition inside Freedom Brands, the holding portfolio I am building from zero to one hundred million dollars." The letter of intent was signed in January; closing slipped by about 2 months after the first bank lined up "for the SBA loan" was shut down. His June-July report adds that the brands were taken over "through A La Carte Research Inc." Seller and price aren't disclosed.
The newsletter started in June, under the line "Documenting our journey from $0 to a $100 Million exit." Its About page says what it's for:
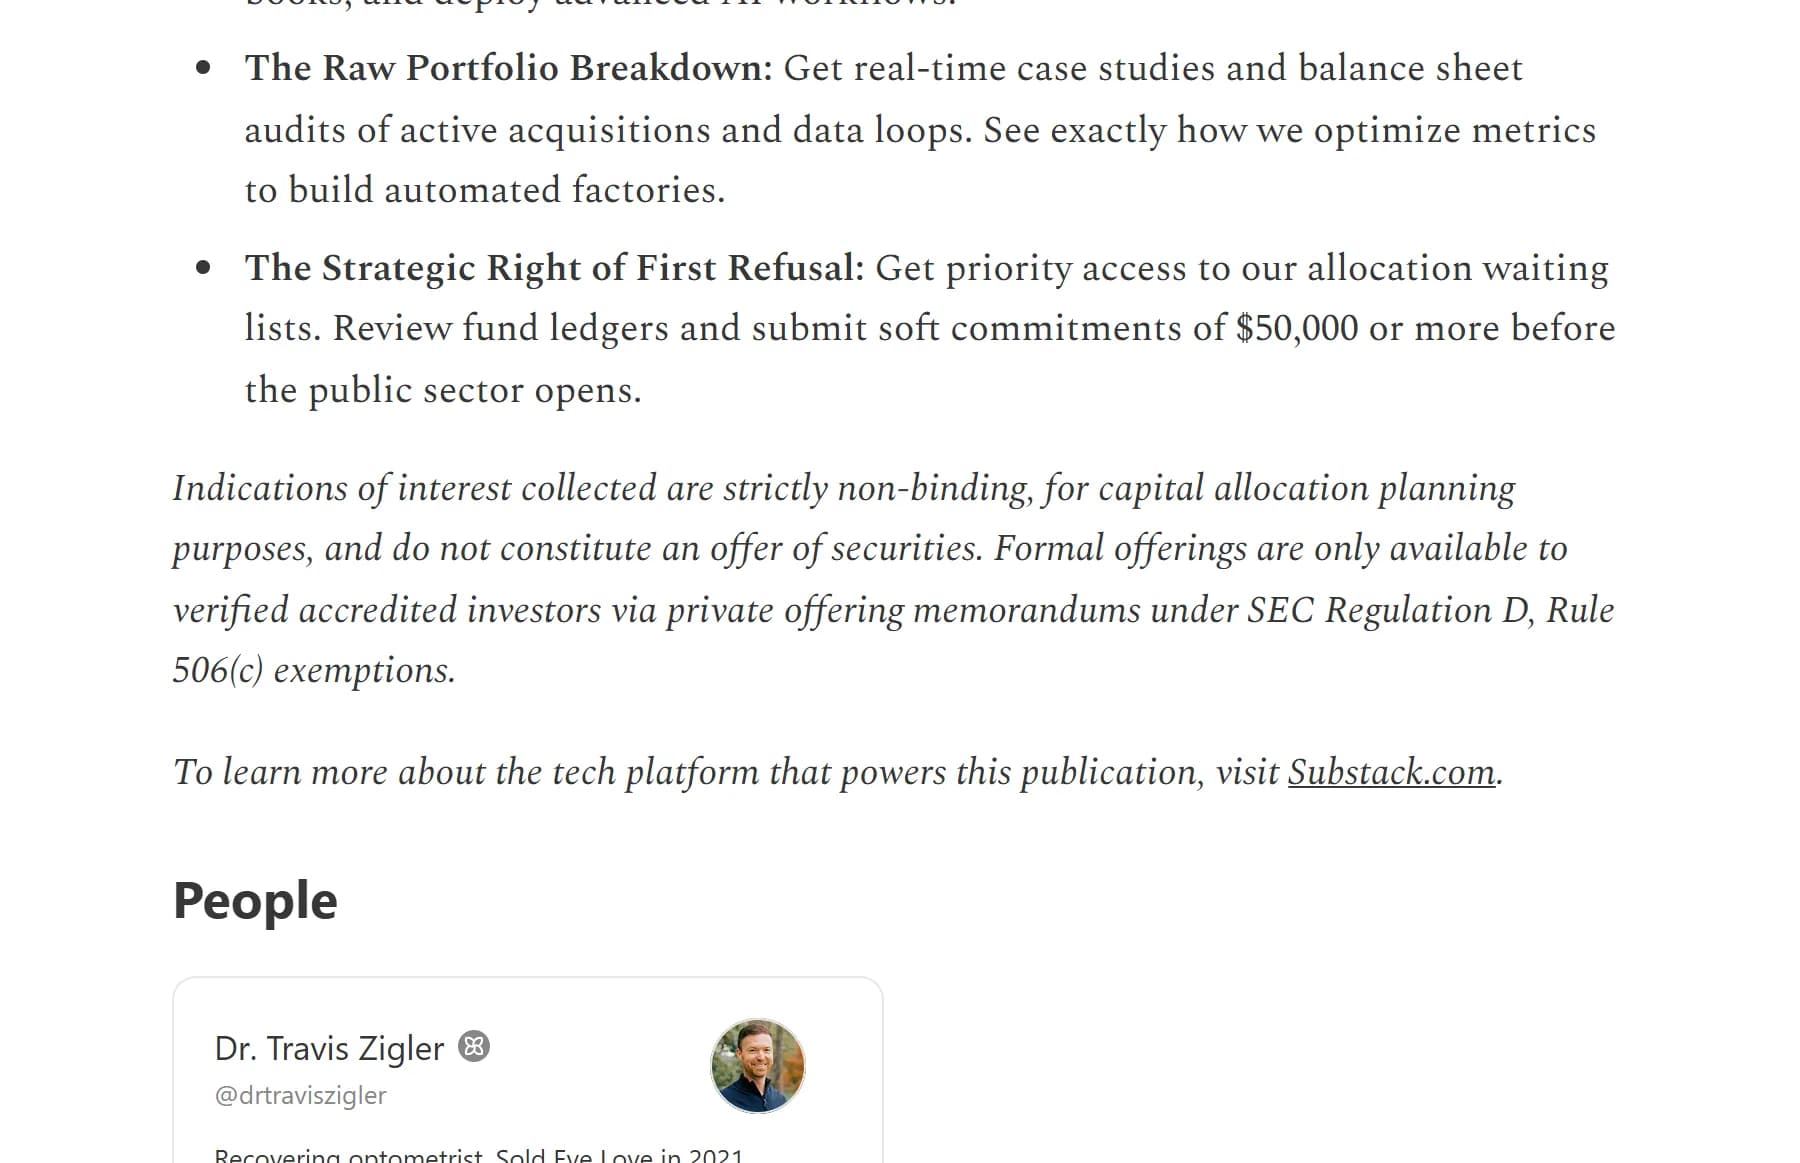
Free readers "get immediate alerts on upcoming Freedom Brands capital raises before blocks cap out." Paid readers can "submit soft commitments of $50,000 or more."
And the October report itself does 3 more jobs. It ends with a free webinar and a pitch: "We have a new offer called the PPC Profit Booster Operating System," with a link to book a strategy call at Profitable Pineapple. Its line "The numbers come from Helium 10 Connected to Claude (which I highly recommend)" links through helium10.pxf.io, an affiliate tracking domain. And the 2 storefront links at the bottom carry Amazon Attribution tags (maas=maas_adg_..._afap_abs), so sales from readers are measured as external traffic.
Our take: none of this makes the numbers false. It does mean the reports are published by someone raising money for the business they describe, selling the method they credit and earning on the tool they cite. That's the reason to check them, not to dismiss them.
The October numbers and what they say
2 terms carry this report:
- ACOS, advertising cost of sales. Amazon Ads defines it as "ad spend ÷ ad revenue" × 100, the inverse of ROAS. It judges the ads by the sales Amazon attributes to them.
- TACoS, total advertising cost of sales: ad spend divided by all sales, ad and organic. It isn't an Amazon Ads metric; tools such as Helium 10 report it. Media buyers outside Amazon know it as the inverse of blended ROAS.
Our math: $42,653 / $374,932 is 11.38%, and $80,166 / $374,932 is 21.38%, both as reported. At 44.11% ACOS, the ads drove $96,697 in attributed sales, a ROAS of 2.27, or 26% of revenue. The other $278,235, 74%, came without an attributed ad click: organic search, the Prime Big Deal Days placement, an influencer post and returning buyers.
Zigler's reading: "I watch TACoS more than ACOS." TACoS fell from 12.59% in September to 11.38%, so "our sales grew faster than our ad spend did."
Year over year: what the extra $14,636 bought
His year-over-year comparison, with the 2 rows we derived from his ACOS:
Metric | October 2025 | October 2026 | Change |
|---|---|---|---|
Revenue | $314,470 | $374,932 | +19.2% |
Ad spend | $28,017 | $42,653 | +52.3% |
Ad-attributed sales, derived | $85,995 | $96,697 | +12.4% |
Other sales, derived | $228,475 | $278,235 | +21.8% |
TACoS / ACOS | 8.91% / 32.58% | 11.38% / 44.11% | +2.5 / +11.5 points |
Our math: the extra $14,636 of ad spend brought $10,702 of extra attributed sales. That's an incremental ACOS of 137%: on Amazon's own attribution, the added ad dollars cost more than the sales they bought. The growth sits in the other 74% of sales, up $49,760, with listing sessions up 44.2%.
Zigler's explanation is rank: Q4 campaigns "more aggressive now to buy rank," on the theory that ad-driven sales lift organic placement. That's a real mechanism on Amazon, and it's what TACoS is meant to capture. It's also impossible to prove from these numbers, because the same month had a deal event, an influencer post and the start of gift season. His own sentence is the honest one: "A good part of our growth was bought with ads."
Our take: this is the lesson for any buyer who runs paid traffic next to organic demand. When the channel ROAS falls and the blended number holds, look at the marginal dollar. Here the marginal dollar lost money on attribution, and the case for it rests on spillover the report can't measure.
Plan versus actual: 4 points over his own targets
On August 10 Zigler published a Q4 plan with blended TACoS targets: "around 7%" in August, "around 8%" in September and October, which "lines up with the 7.25% blended average we have seen historically." His results, from his own dashboards and the October report:
Month | Target TACoS | Actual TACoS | Ad spend | Over target |
|---|---|---|---|---|
August | about 7% | 11.3% | $32,924 | about $12,500 |
September | about 8% | 12.6% | $40,937 | about $14,900 |
October | about 8% | 11.4% | $42,653 | about $12,700 |
Our math: 3 months in a row TACoS ran 3.4 to 4.6 points above target, about $40,000 of ad spend beyond his own plan. In October the plan also said Earth's Daughter would run at 29% ACOS and gift keywords would launch "at a looser 45% ACOS ceiling for the first two weeks" before tightening "toward the 35% range". The report says instead: "In early October we raised the target ACOS on our single flavor lip balms to 48%."
Our take: changing a plan mid-season isn't a mistake. Not mentioning the plan when you report the result is a gap. A reader of the October report sees TACoS "fall" from 12.59% to 11.38% and never learns that the target was 8%.
The profit that shrinks a month later
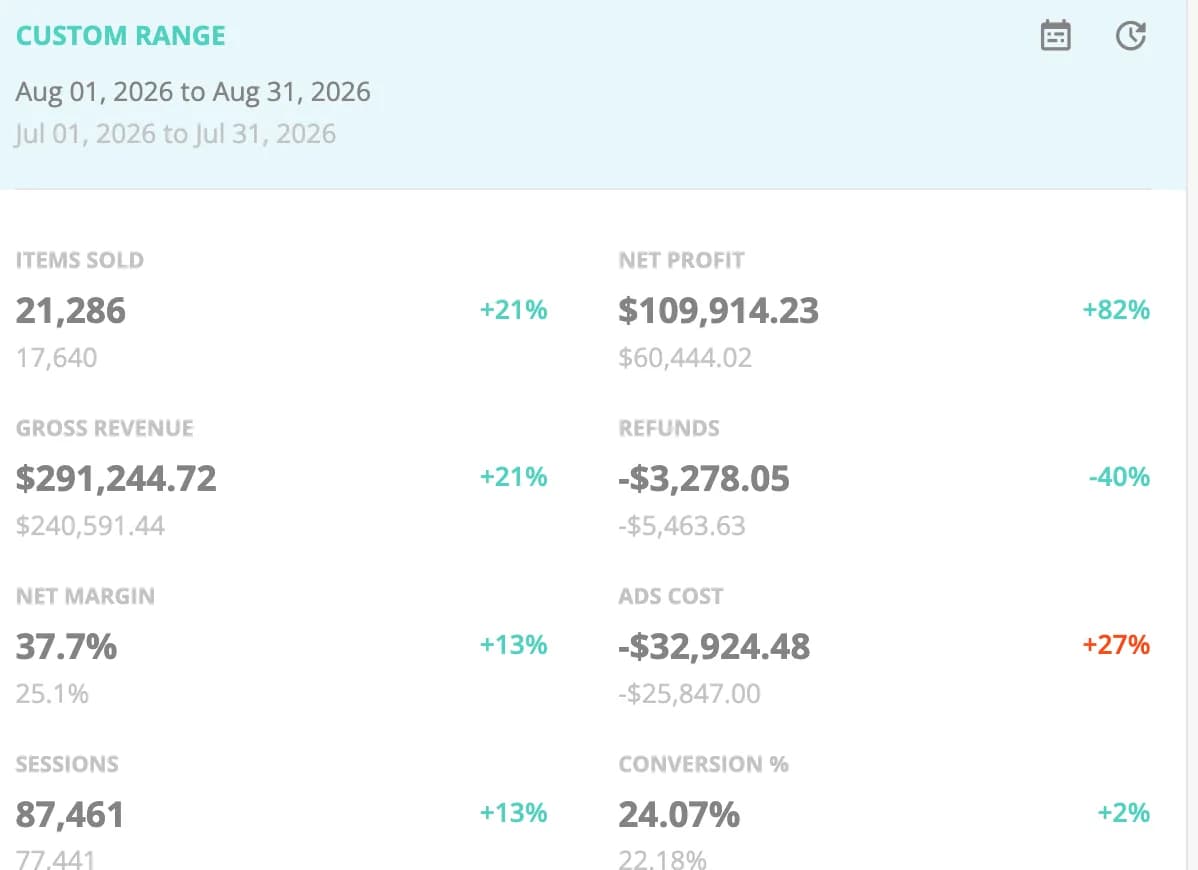
This is the part of the series that doesn't hold. In his August and September reports Zigler posted screenshots of his profit dashboard. Each month's net profit appears twice: in that month's report and as the base in the next one.
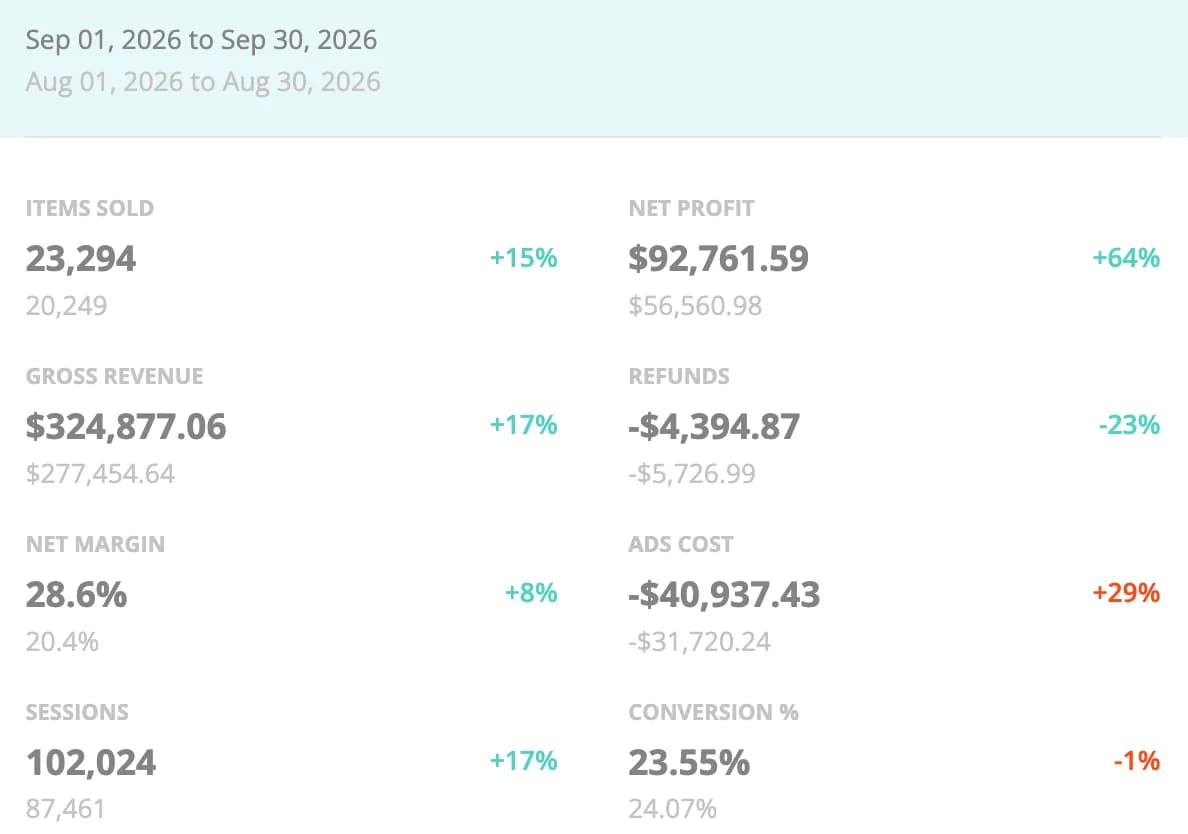
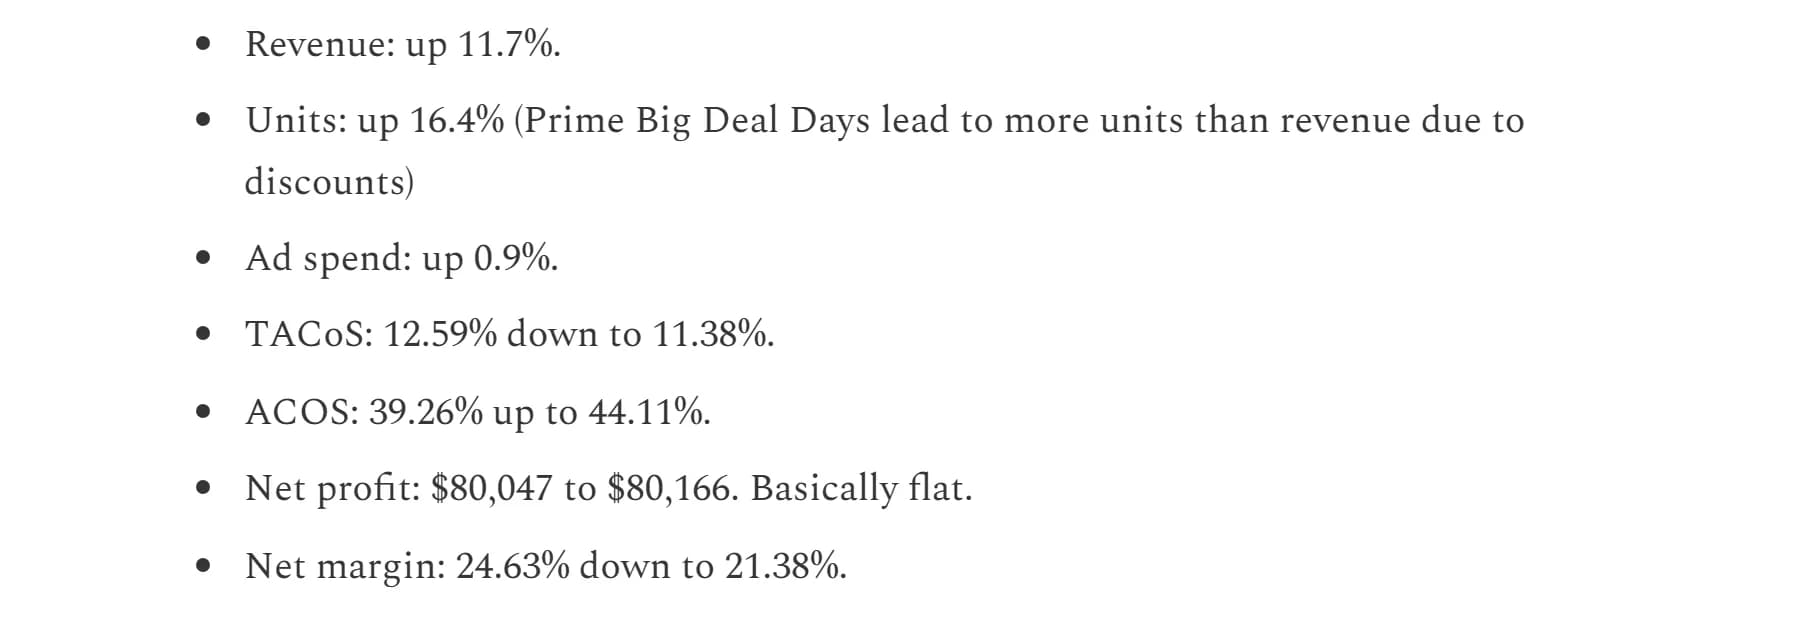
Month | Profit in its own report | Profit 1 report later | Change |
|---|---|---|---|
August | $109,914, 37.7% margin | $56,561, 20.4%, for August 1-30 | -$53,353, -49% |
September | $92,762, 28.6% margin | $80,047, 24.63% | -$12,715, -14% |
October | $80,166, 21.38% margin | not yet published | ? |
Our math: September's revenue and ad spend didn't change between the 2 reports: $324,877 and $40,937 give 12.6% TACoS in both. Only the profit moved, by $12,715. August's later figure covers 1 day less, but August 31 would have to make $53,353 of profit on $13,790 of sales to explain the gap. It's a restatement.
2 more mismatches in the same reports. The September text says that versus last September "profit up 32%," while its own screenshot shows $92,761.59 against $60,973.13, up 52%. And August revenue is "$291,000" in the August report and "$280,000" in the September one.
The likely reason is ordinary: on Amazon, fees, storage charges and refunds keep landing after the month ends, and profit tools recalculate. What isn't ordinary is reporting the first number as the result, then quietly using the lower one as the base next month, without a note. The October report never mentions that September's profit was $92,762 a month earlier.
That changes its headline. "Profit stayed flat" compares a fresh October with a revised September. If October is revised like September, by 14%, it lands near $69,000, 14% below September's revised figure. Then the honest headline is "profit fell."
Treat a month-end profit like a pending conversion. In 2 of the reports we could check, the first profit figure was later cut by 14% and 49%. Before you compare months, or copy someone's margins, ask which figure is final and when fees and refunds stopped landing for that month.
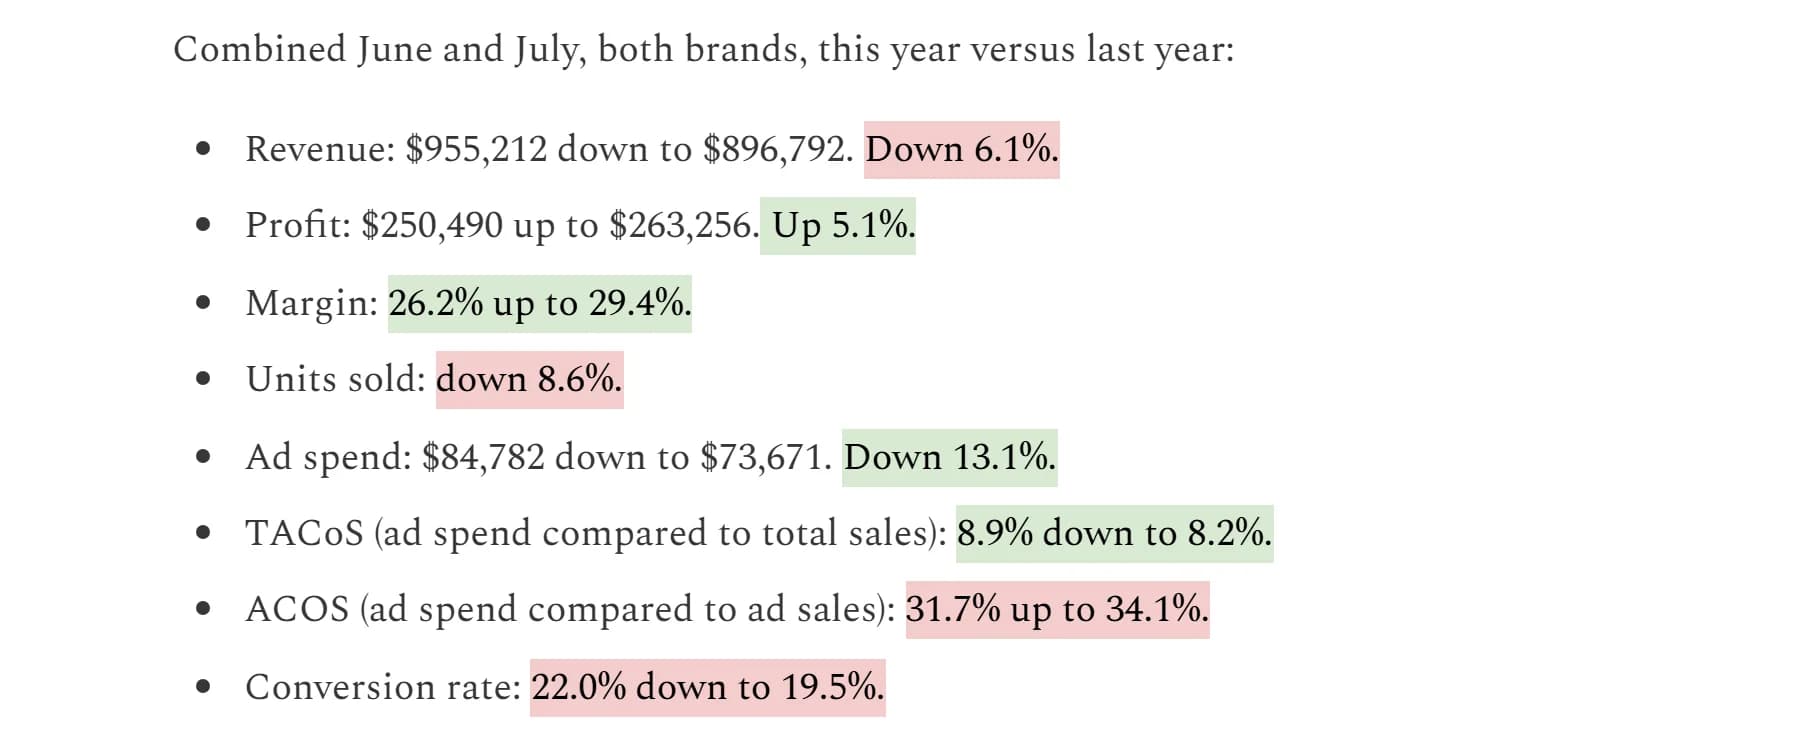
A 3rd puzzle sits further back. The June-July report gives the 2 months combined as $896,792 in revenue and $263,256 in profit. The August dashboard puts July alone at $240,591 and $60,444. That leaves June at $656,201 and $202,812: 75% more revenue than October, with 30.9% margin, in what he calls "our dead zone" from June through October. Prime Day fell in June, which explains part of it. The reports never show June alone, and we can't make these numbers fit together.
What the deal week and the cedar sachets show
The October report has 2 genuinely useful details for anyone who buys traffic.
The deal week. Amazon's Prime Big Deal Days ran 48 hours, October 6 and 7. Zigler's report counts a wider window, "October 5 to 11," with $110,415 in sales at a 27.2% margin.
Our math: that week brought 29% of the month's revenue and about $30,000, or 37%, of its profit in 7 days. The other 24 days ran at a 19% margin. His October 8 post adds a clean test on 1 product, the organic lip balm, at the same discount: on October 6, with a coupon and an influencer post, it sold $17,391; on October 7, as a Prime deal, $21,047 and $2,263 more profit, for $77 more in ads. "The difference was how the customer got the discount, and where Amazon showed it."
The cedar sachets. The Cedar Chips and Lavender Sachets 20-Pack was forecast to run out "around December 1," with the next shipment weeks later. So he slowed it down: price from $23.97 on September 11 to $24.97 on October 5 and $26.97 on October 12, and ad spend on it cut "by more than half" in the week ending October 18. Units fell 21.6% from September and profit from $12,255 to $9,209. "Running out of stock in the middle of Q4 costs far more than a slower October."
Our take: this is the best decision in the report, and it translates directly to affiliate work. When an offer has a cap, a budget or a stock limit, slow down before you hit it, with bids and price, instead of running at full speed into a wall. A sold-out listing loses its organic rank; a capped offer loses its traffic history.
The mix. Profit stayed flat while sales grew because the moth products earn 29-32% margins and the lip balm 18-19%, and October is lip balm season. The top 5 products made $47,682, 59% of the month's profit. From his profits and margins, the Organic Lip Balm 6-Pack sold about $69,000 at 17.6%, the Clothes Moth Traps 6-Pack about $36,700 at 32.1%.
Where affiliates fit in a seller's ad math
2 programs connect a brand like this one to outside traffic.
- Brand Referral Bonus. Per Amazon Ads, it "can give US Seller Brand Owners a credit worth an average of 10% of qualifying sales measured with Amazon Attribution." Zigler's own storefront links carry Attribution tags, which is how a newsletter becomes a measured traffic source.
- YouTube Shopping. On August 27, 2026, YouTube announced that "Amazon is officially part of the YouTube Shopping Affiliate Program," so eligible US creators can tag Amazon products in their videos. Zigler's September 1 post on it argues that it "changes the math on your ad spend"; the argument itself is behind his paywall.
Our take: if you pitch an Amazon brand on outside traffic, compare your cost per sale with the brand's ACOS, 44% in this report, not with its TACoS of 11%. The ACOS is what it pays Amazon for an ad-driven sale; the TACoS is diluted by sales it gets for free.
Fact-check: what the author showed and what they hid
We rate every case on 10 points: what an outsider needs to judge the result and repeat it. We scored the October report together with the 4 reports and the About page behind it. Like most case studies, this one is selectively true rather than fake.
Point | Status | What we found |
|---|---|---|
Setup: period, market, product, model | Showed | October 2026, 2 brands combined, product names, Amazon ads. The market isn't stated; the storefronts are on Amazon.com. |
Author and independence | Partial | A real, findable owner who sold a previous brand. His newsletter collects interest for Freedom Brands capital raises, pitches his PPC agency's system, and links the data tool through an affiliate link. |
Finances | Partial | October reconciles internally to the cent. But the 2 previous months' profits were cut by 14% and 49% in the next report without a note, and the June-July totals don't fit the monthly figures. |
Proof | Partial | Profit dashboards for August and September, which contradict his later text. For October, only 3 charts generated for the post, with no dashboard. |
Source and targeting | Partial | Target ACOS, the 48% change for single-flavor lip balm, the Q4 gift plan, coupons off during the deal event and the cut on cedar. No campaign results, keywords or bids for October. |
Tools | Showed | Helium 10 connected to Claude, and Amazon's Manage Your Experiments for image tests. |
Creatives | Partial | The listing image revamp is described in the June-July report. On Sponsored Products the listing is the ad, and the storefronts are public. |
Landing pages and flow | Showed | The product listings are the landing pages, linked from the report, with the cedar price steps by date. |
Consumables | Hid | Product cost, Amazon fees, inventory and loan payments aren't given, and "net profit" isn't defined. |
Repeatability today | Partial | An affiliate can't repeat it: it takes owned inventory and acquired brands. The way he reads ACOS, TACoS, deal weeks and stock limits transfers to any paid traffic. |
Score: 2/5. The October report is detailed, internally consistent and unusually candid about ads that didn't pay. It doesn't score higher because its result, profit, isn't a stable number: in both months we could check, his own dashboard figure was cut by 14% and 49% a report later, with no mention, and the "flat" headline rests on that revision. October itself has no dashboard, the series contradicts itself on June-July, August revenue and September's growth rate, and the publisher sells investment allocations, PPC services and the data tool. Good lessons, moving numbers: a 2, not a 3.
Checklist: what to do
Questions and answers
What is TACoS on Amazon?
Total advertising cost of sales: ad spend divided by all sales, from ads and organic, as a percentage. In this report it was 11.38% in October: $42,653 of ads on $374,932 of sales. Amazon Ads doesn't report it; tools such as Helium 10 do.
What is the difference between ACOS and TACoS?
ACOS divides ad spend by the sales Amazon attributes to the ads; TACoS divides it by all sales. Here ACOS was 44.11% and TACoS 11.38%, because ads drove about a quarter of the month's sales. ACOS judges the campaigns, TACoS the whole business.
Is a 44% ACOS bad?
It depends on margin. A product with a 30% margin before ads loses money on every ad-driven sale at 44% ACOS, and the seller is betting that those sales lift organic rank. In this report, the incremental ACOS on the extra year-over-year spend was 137%.
Why can profit stay flat when revenue grows?
Because of mix and ads. In October more of the sales came from lip balm at 18-19% margin and fewer from moth traps at 29-32%, while ACOS rose. Sales grew 11.7% per day versus September and profit didn't move, on the revised September figure.
What is Amazon's Brand Referral Bonus?
A program that gives US brand owners on Amazon a credit worth on average 10% of qualifying sales from outside traffic, measured with Amazon Attribution tags. It's why brands track newsletter, video and affiliate links to their listings separately.
Author’s conclusion
This report is worth reading for the right reasons and checking for the others. It says what most sellers hide: that ad spend grew 52% to buy 19% more revenue, that the extra dollars lost money on attribution, and that a product was slowed on purpose to avoid running out in December. The math inside October holds to the cent. The problem is the series around it. Profit, the number the whole report is about, changed after publication in both months we could check, by 14% and 49%, and the October headline compares a new figure with a revised one without saying so. Add the missing October dashboard and a newsletter that raises capital and sells the method, and you have a 2.
My advice: take the reading, not the numbers. Track your blended cost of ads next to your channel ROAS, and look at the marginal dollar whenever they move apart. Write your targets down and report against them. Slow down before a cap, not at it. And whenever someone shows you a month's profit, theirs or your own, ask when it stops changing.
Lu Discover, Editor-in-chief
Our verdict on this case
The October report is detailed, internally consistent and unusually candid about ads that didn't pay. It doesn't score higher because its result, profit, isn't a stable number: in both months we could check, his own dashboard figure was cut by 14% and 49% a report later, with no mention, and the "flat" headline rests on that revision. October itself has no dashboard, the series contradicts itself on June-July, August revenue and September's growth rate, and the publisher sells investment allocations, PPC services and the data tool. Good lessons, moving numbers: a 2, not a 3.
Our fact-check of the public case: what the numbers show, what is missing. Scores are never for sale.
Sources for this article
- drtraviszigler.substack.com — Dr. Travis Zigler: Earth's Daughter and Professor Killamoth Income Report, October 2026 (November 4, 2026)
- drtraviszigler.substack.com — Dr. Travis Zigler: We Lost Money on Some Ads on Purpose, and Profit Still Jumped $35,000, September 2026 report with the profit dashboard (October 6, 2026)
- drtraviszigler.substack.com — Dr. Travis Zigler: August 2026 Income Report with the profit dashboard, partly paid (September 1, 2026)
- drtraviszigler.substack.com — Dr. Travis Zigler: Earth's Daughter and Professor Killamoth Income Report, June and July 2026, with the Q4 Amazon PPC plan (August 10, 2026)
- drtraviszigler.substack.com — Dr. Travis Zigler: Same Discount, Same Product, 21% More Sales, Prime Big Deal Days test (October 8, 2026)
- drtraviszigler.substack.com — Dr. Travis Zigler: The day I bought two brands: Freedom Brands, letter of intent in January, SBA loan (June 25, 2026)
- drtraviszigler.substack.com — Dr. Travis Zigler: newsletter About page: Freedom Brands capital raises, soft commitments of $50,000 or more, Regulation D Rule 506(c)
- drtraviszigler.substack.com — Dr. Travis Zigler: Amazon Just Gave Every YouTuber a Built In Amazon Attribution Link, partly paid (September 1, 2026)
- advertising.amazon.com — Amazon Ads: What is ACOS: ACOS = (ad spend ÷ ad revenue) x 100
- advertising.amazon.com — Amazon Ads: Brand Referral Bonus in Amazon Attribution reporting: a credit worth an average of 10% of qualifying sales
- aboutamazon.com — Amazon: Prime Big Deal Days is back October 6-7, 48 hours of deals (2026)
- blog.youtube — YouTube: Amazon joins the YouTube Shopping Affiliate Program, by Travis Katz (August 27, 2026)
- helium10.com — Helium 10: Helium 10 MCP: connect Helium 10 to Claude, ChatGPT or your own agent
Related stories
 Case fact-check
160% ROI on $120 of Pops: Fact-Checking a Gaming Case Won After the Traffic Stopped
 Case fact-check
Adult Comics Test Diary: $99.79 on HilltopAds and TrafficJunky, 27 Sign-ups, 0 Sales
 Case fact-check
Comments
0 commentsNo comments yet.
Add a comment